Strava stats and reports
Take your training to the next level with our Strava stats and reports. My Workout Companion helps you uncover powerful insights from your Strava data. It is your gateway to comprehensive insights into your fitness journey. Whether you’re a cyclist, runner, or fitness enthusiast, our reports turn your activity data into meaningful performance insights.
Our reports come in three main types: All-Time Reports, Yearly Reports, and Monthly Reports.
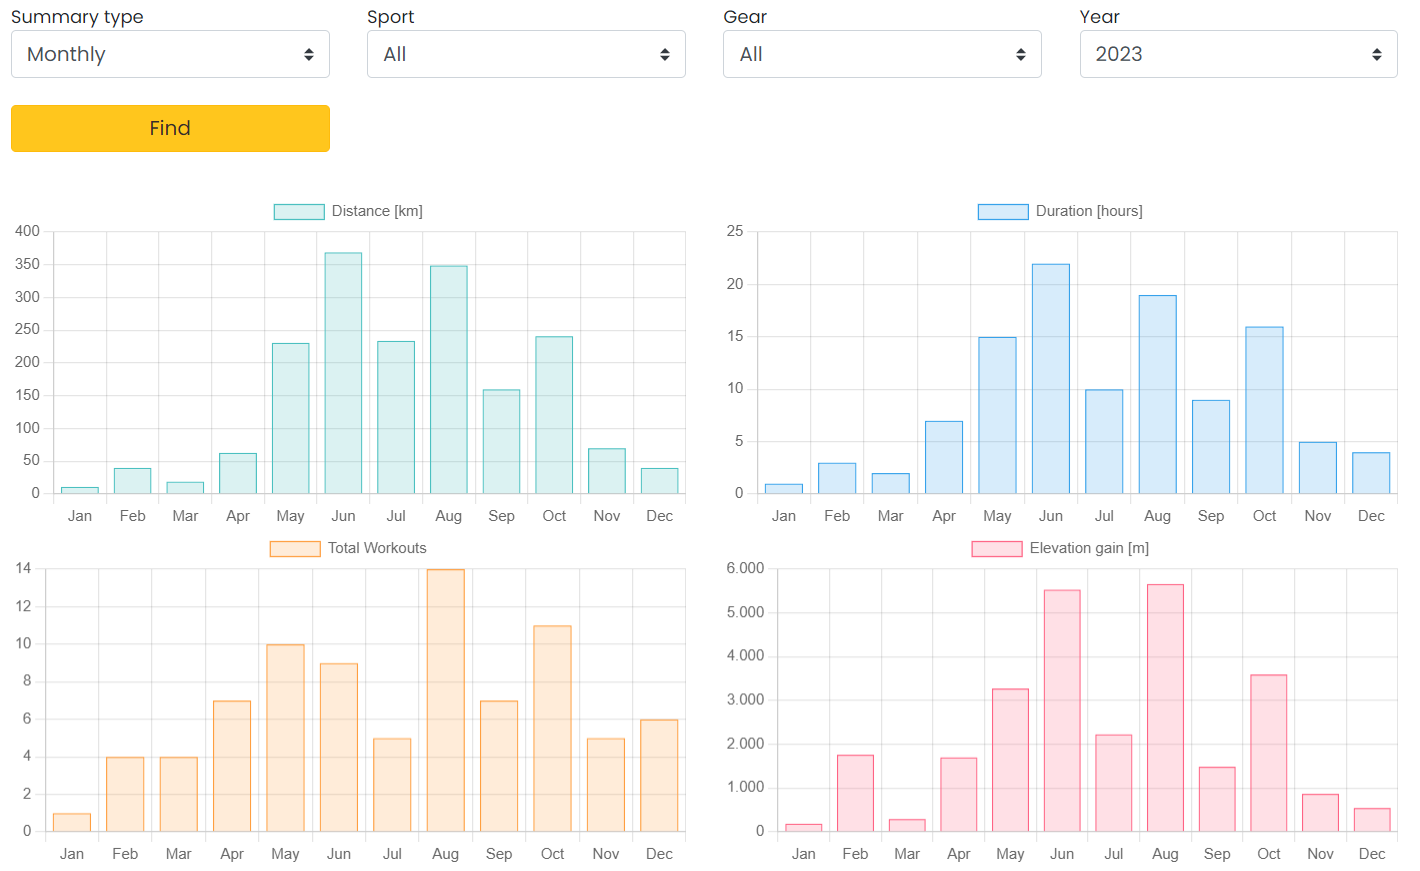
For each report type, you can filter your data by sport and equipment, allowing you to focus on the metrics that matter most to your training. Data is presented in tables as well as a variety of charts, including bar charts, pie charts, and polynomial graphs, giving you both high-level overviews and detailed visual analysis of your workouts.
All-Time Reports
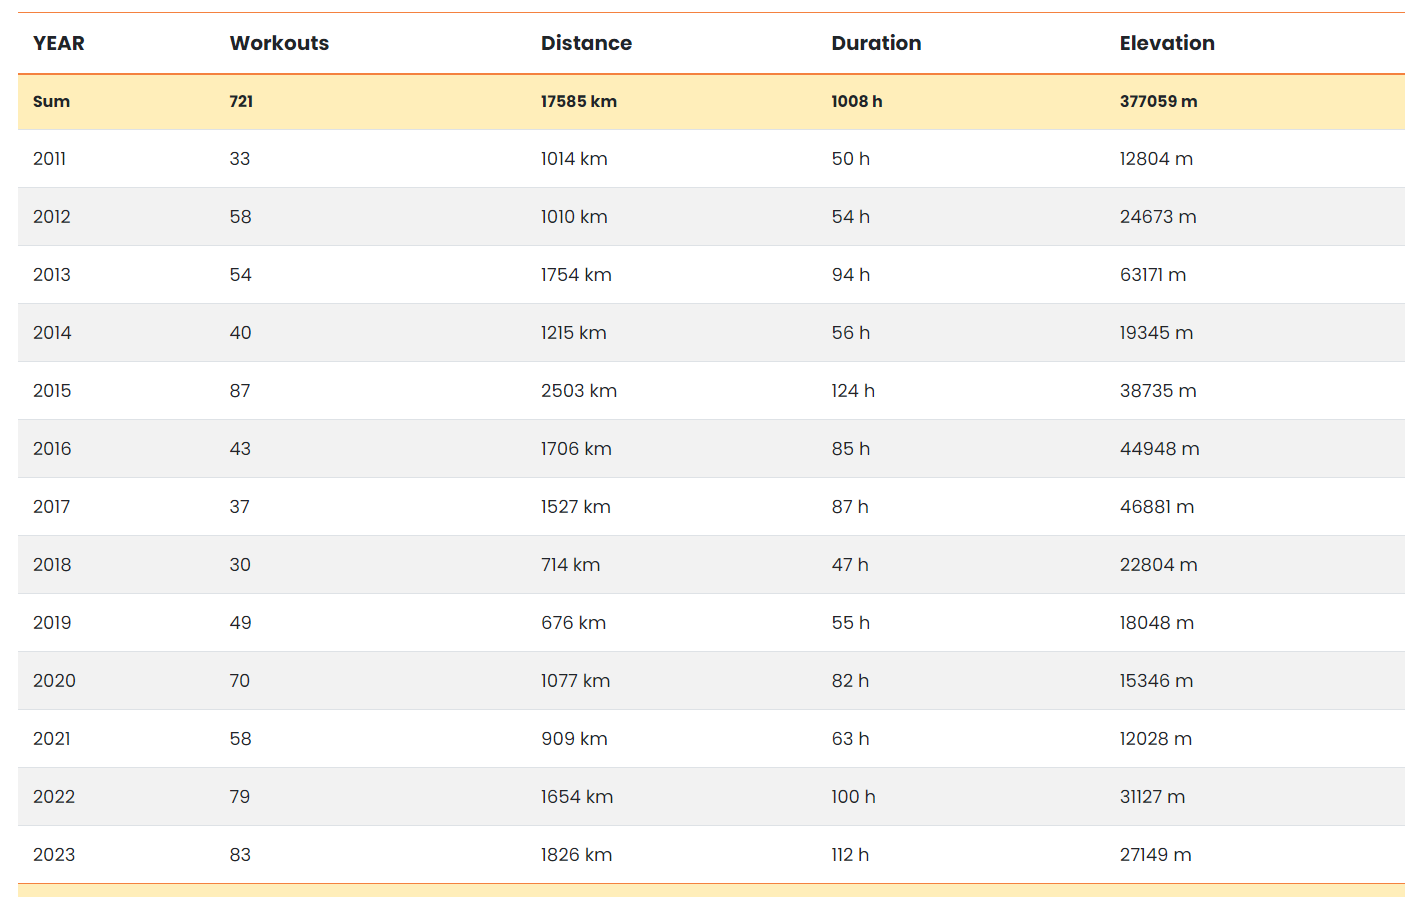
In the All-Time Reports, users can explore comprehensive data visualizations covering every year of their Strava activity. Gain a nuanced understanding of your long-term progress as you compare yearly metrics such as distance traveled, elevation gain, number of workouts, and total exercise time.
These insights are thoughtfully presented through interactive graphs and detailed tables, giving you a clear picture of your evolving fitness journey. You can further refine your exploration with pie charts illustrating the distribution of sports and the equipment most frequently used.
For even greater detail, filter your data by specific equipment, such as bikes or running shoes, to analyze performance trends across different setups.

Yearly Reports
Dive into the specifics of each year with our Yearly Reports. Here, your fitness data is meticulously organized by month, allowing you to examine your progress and accomplishments throughout the selected year.
All the detailed charts and visuals available in the All-Time Reports are seamlessly integrated into this section as well. You can apply filters to refine data by sport and year, helping you focus on the metrics that matter most to your performance.
Additionally, you can analyze your activity trends month by month, discovering patterns such as when you typically start summer workouts, the months with the highest cycling, running, hiking, skiing, or other activities. This gives you a clear overview of seasonal trends and helps plan future training more effectively.

Monthly Reports: A Daily Chronicle
For a more detailed examination, our Monthly Reports break down data by day, providing a daily chronicle of your fitness journey. This report introduces an additional layer of filtering, allowing users to refine data by month.
With this report, you can see the exact distance covered or duration of workouts each day, track how many consecutive days you’ve been active, and easily identify rest days. It’s the perfect tool for analyzing short-term progress, spotting patterns, and staying on top of your daily training routine.
Summarized Insights Across All Reports

